Home > Overview
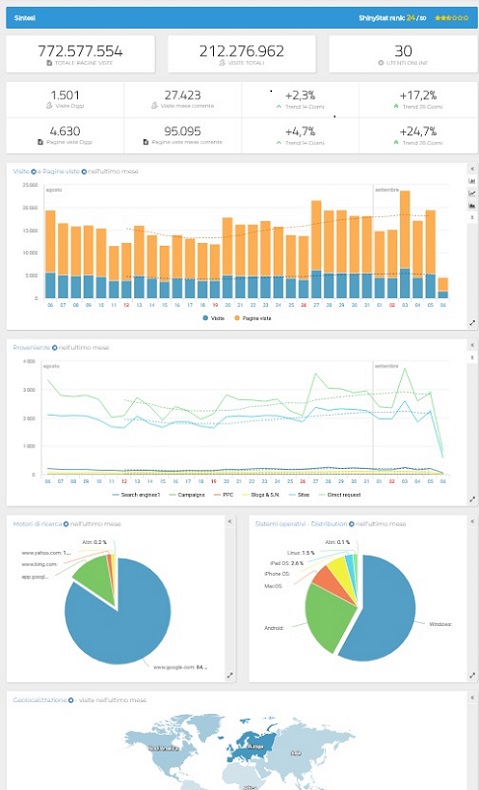
The “Home” represents the entry page to the dashboard and is set up to offer an overview of the traffic data trend.
In the first table you will find a summary of the traffic received by the site.
The data displayed in the dashboard is updated in real time.
In the first instance it is possible to view some summary data related to visits and page views totaled by the creation of the account, today and in the current month.
The trend indicates the increase or decrease in visits and page views compared to the last 14/28 days.
The indication of online visitors provides an estimate of users connected to the site when the report is opened.
The ShinyStat™ Rank (SR) reached by the site is displayed at the top right.
This is the ShinyStat™ index that defines the popularity of the site based on the number of visits and an algorithm that considers different parameters and metrics of Web Analytics.
The graph in the center shows the daily trend of Visits and Page Views in the last month, showing at a glance if there have been significant changes in the last period.
The following graph shows the trend of visits according to traffic sources (Direct Request, Search Engines, Sites, Blogs and Social Networks, Campaigns, PPC).
In the event of traffic changes, it allows easy identification of the source of "responsible" origin of any peaks or drops in visits.
The two pie charts provide an image of the composition of traffic based on the Search engine referrers and the operating systems used.
In particular:
- Search engines: the graph shows the percentage composition of visits based on search engines
- Operating systems: shows the percentage composition of visits based on the Operating Systems used
Thanks to these reports it is possible to identify the most used search engines and operating systems to visit the site.
Finally, the Geolocation report allows you to immediately view the geographical areas from which the site has received the most visits.
Thanks to a different gradation of colors it is possible to identify with a glance the distribution of the visits according to the geographical location.

List of metrics that can be viewed in the Summary report:
- ShinyStat™ Rank: indicates the success rate achieved over time based on ShinyStat™ metrics
- Total visits: indicates the total number of visits totaled since the account was created
- Online users: indicates an estimate of the users connected to the site when the report is consulted
- Visits / Page views today: indicates the number of visits and page views totaled in the current day
- Visits / Page views during the current month: indicates the number of visits and page views totaled in the period
- Trend 14/28 days for Visits and Page Views: expresses the percentage variation of data measured in the second half of the period compared to the data totaled in the first half of the same period
- Comparative graph - Trend of Visits and Page views in the last month
- Comparative graph - Trend of Referrers in the last month
- Search engines: expresses the percentage of visits received by the various engines in the last month
- Operating systems: percentage of visits received by the various operating systems in the last month
- Geolocation: indicates the number of visits received from different geographical areas in the last month

