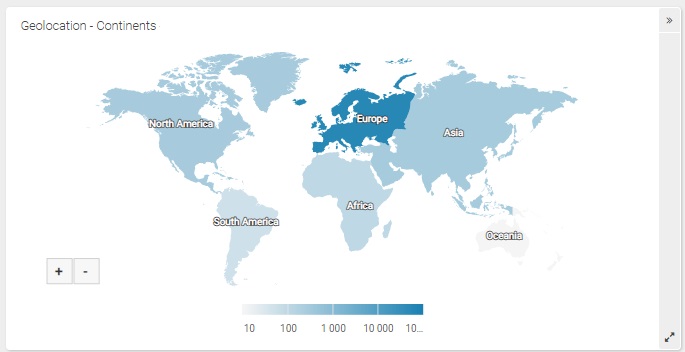
ShinyStat™ Video Analytics - Geolocation of video views
How can I see in detail the Geolocation of video views for my videos? In which geographical areas do my videos perform better?
The Geolocation reports provided by ShinyStat™ Video Analytics show you in real time the geographical areas where your videos are performing better.
In this report, video views are grouped depending upon the geographical area of the viewers.
Clicking on the map or table, you can analyze the views location, grouping them by Continents, by Countries, by Regions (only for Italy) and by Cities.

Watch Out!
Unlike all other information in our platform, which are directly collected by ShinyStat, data for the geolocation of IP addressess are based on the parameters provided by the TLC companies of each country to the international bodies in charge of IP assignment.
Any resulting anomaly or inaccuracy is not attributable to ShinyStat.
Filters
- Time period: by using the drop-down menu you can filter the data for the time period you want to analyze.
- Advanced calendar: you can select specific time periods other than those available with the drop-down menu "time period", thereby choosing freely the time period to examine. For more info on using the Advanced calendar, click here.
Map
Here are some useful tips in looking up the map:
- Each geographic area is shown in a different shade in connection with the number of views. A lighter shade indicates the areas with less visitors; the shade becomes darker as the number of visitors increases.
- Passing the mouse over a geographical area, a note appears showing the corresponding number of views.
- Clicking on a geographical area, the map refreshes and shows only the selected area. Then you can proceed with the consultation moving from continents to countries, and from countries to cities.
- Clicking on a city, you can access the report showing the trend of the views coming from it.
-Only for Italy another report is available, providing data collected region by region, but this is not available for other countries. If you want instead to display all the Italian cities where views are coming from, without reference to the region, just click on "Disable regional display" underneath the map.
- After making a first selection, you can move inside the map using the option "click to enable map manual scrolling" underneath the map. This option must be unchecked once you have found the area that interests you.
- In order to make the report easier to read, a maximum of 200 cities will be displayed at any given time. To view the next batch of 200 cities, click on the little arrow to the right of "1-200 cities viewed of [total number]"
Table
The table follows the same criteria of the map, and you can go into more and more details, moving from Continents to Countries, and from Countries to Cities, clicking on the names of the different geographical areas. Data for Italy, like in the map, are also collected region by region.
Watch Out!
Keep in mind that this report remains protected by a password even in the event that you choose to make your own statistics available to the public by deselecting the option "Protect your reports with a password", in Configuration > Preferences.
