ShinyStat™ Adbock Analytics – Weekly unique visitors with adblock
How many times your site is visited by weekly unique visitors who use an adblocker to exclude advertising messages? How much revenue are you losing?
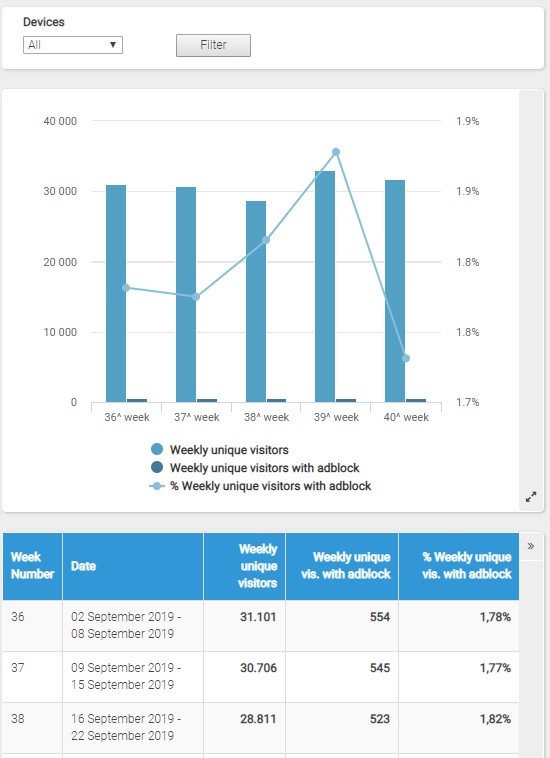
The report titled "Weekly unique visitors with adblock" shows the number of weekly unique visitors who have visited your site with an adblocker.
In the first table, for the selected time period, you can see:
- Weekly Unique Visitors: the total number of weekly unique visitors in the selected period
- Weekly Unique Visitors with adblock: the number of weekly unique visitors with adblock in the selected period
- % Weekly Unique Visitors with adblock: the percentage of weekly unique visitors with adblock versus the total weekly unique visitors
- Calendar: it allows you to select the time interval for which you want to analyse the traffic data. For more info, click here.
- Devices: this feature allows to sort the data in the underneath table by the selected option (All, Desktop, Mobile, Tablet or Smartphone)

Chart
On its horizontal axis, the chart shows the days or the months of the represented period and, on the vertical axis:
- the total weekly unique visitors (green)
- the weekly unique visitors with adblock (red)
- the percentage of weekly unique visitors with adblock versus the total weekly unique visitors (with blue line)
Table
Each line of the table shows the following information:
- Date: it shows the specific day or month in consideration
- Weekly Unique Visitors: it shows the total number of weekly visitors
- Weekly Unique Visitors with adblock: it shows the number of weekly unique visitors with adblock
- % Weekly Unique Visitors with adblock: the percentage of weekly unique visitors with adblock versus the total weekly unique visitors
Please note: data on newvisitors with adblock is available since:
- June, 1st 2017 in the Business version
- July, 8th 2017 in the Pro version

