Traffic - Monthly unique visitors/browsers
This report shows the unique visitors/browsers per month.
This term refers to the number of unique visitors/browsers who visit the web site once or more a month.

The first table shows the average monthly unique visitors in the selected period and the trend compared with the previous period.
Filters
- Calendar: it allows you to select the time interval for which you want to analyse the traffic data. For more info, click here.
Chart
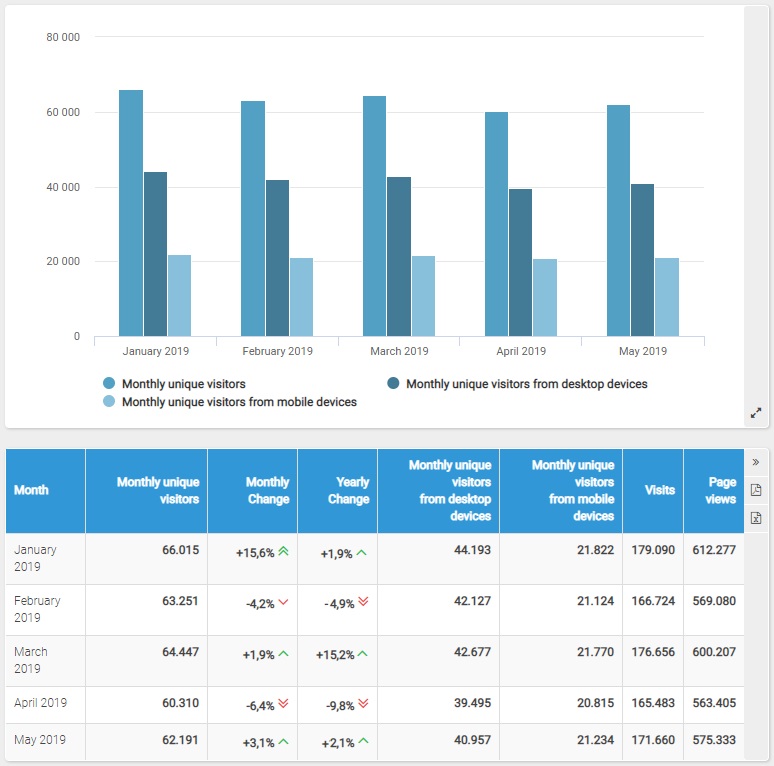
On its horizontal axis, the chart shows the months, and, on the vertical axis, the number of monthly unique visitors/browsers.
Table
The table shows the following data:
- Month
- Number of monthly unique visitors/browsers
- Monthly Change: percentage change (compared to the previous month)
- Yearly Change: the percentage change compared to the same month of the previous year
- Monthly unique visitors from Desktop Devices
- Monthly unique visitors from Mobile Devices
- Visits
- Page views
N.B.
Please note: data on unique visitors split by desktop and mobile users is available since October, 1st 2014.
