Mobile Analytics - Mobile network operators
In this report (named "Mobile Analytics > Mobile network operators") it is possible to know which mobile operators are used by visitors to reach the site.
Filters
Calendar: it allows you to select the time interval for which you want to analyse the traffic data. For more info, click here.

Pie chart
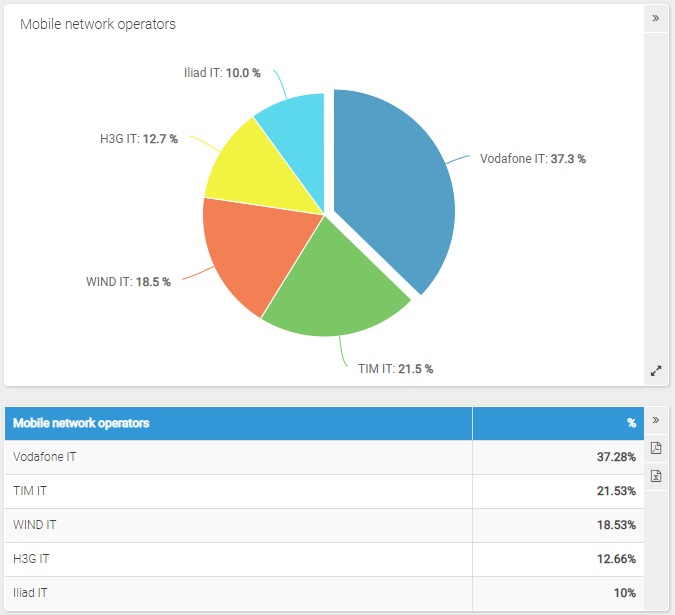
The pie chart shows the percentage composition of the visits according to the origin from the different mobile network operators in the period considered.
Table
The following data is shown in each table row:
- Operator: indicates the mobile network operators used by visitors who have visited the site during the period considered
- Percentage (%): indicates the percentage of visits made using the corresponding operator with respect to the total
Please note: data are available starting from 01/03/2016.

