Monetary Conversions - Conversions sources
Which are the sources that generated the most monetary conversions? Which ones the most revenue? Which ones the best conversion rate?
In the report Monetary conversions - Conversions sources you can see how many monetary conversions have been generated by the traffic sources (could be a Direct request, a Site, a Search Engine, a Campaign, a Pay per Click or a Blog or Social Network) in the selected time period.
In the first summary table, you can find the monetary conversions daily average and the sales daily average.
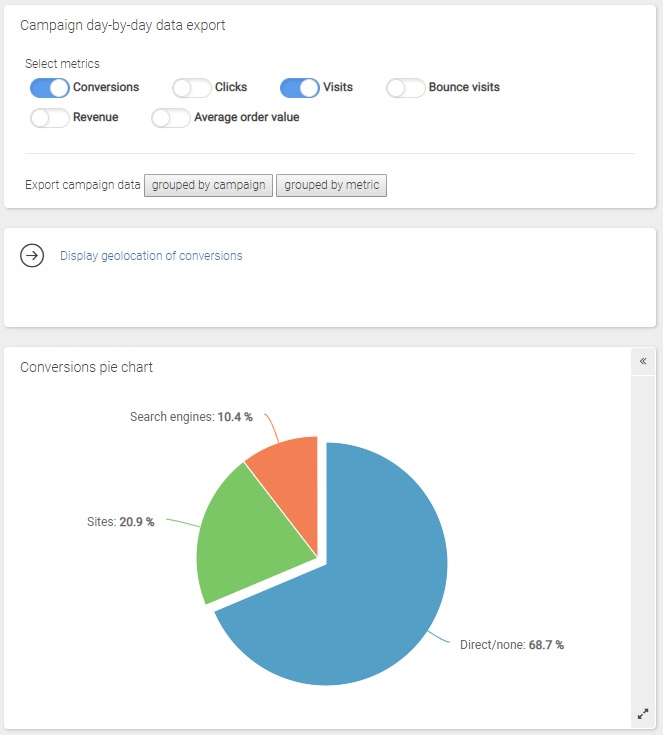
Campaign day-by-day data export
This feature allows you to export campaign data in order to analyse its performances on a daily basis.
In particular, it is possible to select one or more metrics among those available (clicks, visits, bounces) for which you want to export day-by-day data.
By clicking on the option "Grouped by campaign", it is possible to obtain a csv file which shows the list of selected metrics (and related data) for each campaign; so data is displayed campaign by campaign.
It is a useful export when you want to analyse the single campaign by comparing the various metrics, for example visits with clicks and / or with bounces.
By clicking on the "Grouped by metric" option, you can obtain a csv file that shows the list of campaigns (and related data) for each metric.
It is a useful export when you want to compare different campaigns to evaluate which have received more or less clicks, visits and / or bounces.
Moreover, by clicking on the link named "Display geolocation of conversions", you can open the report showing the conversions' geolocation.

Filters
- Calendar: this option allows you to select the time interval for which you want to analyse the traffic data. For more info, click here.
- Select a Monetary Conversion: by using the drop-down menu you can filter the data for the Monetary Conversion you want to analyze.
- Devices: this feature allows to sort the data in the underneath table by the selected option (All, Desktop, Mobile, Tablet or Smartphone)
Chart
The first pie chart (“Conversions pie chart”) shows the percentage distribution of all monetary conversions resulting from different traffic sources, in the selected time period.
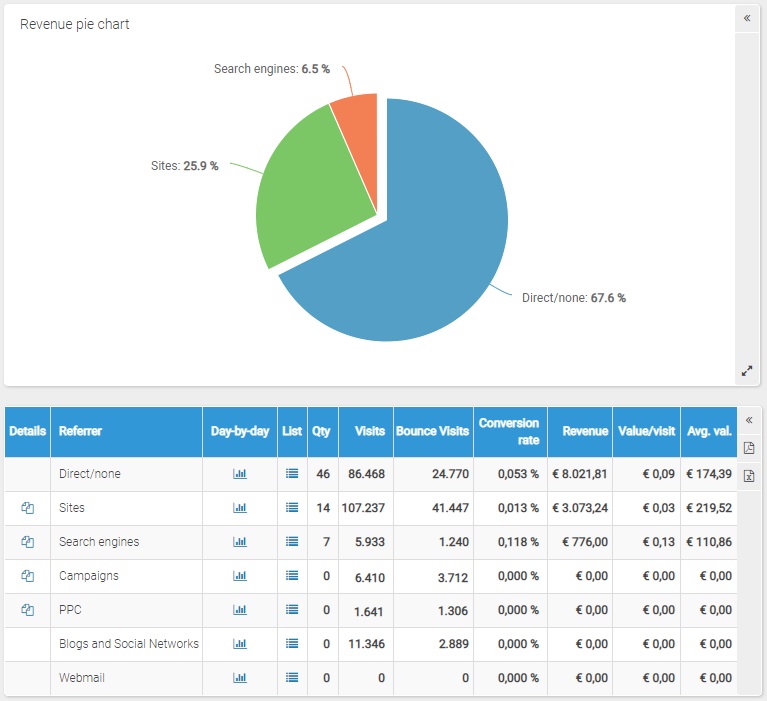
The second pie chart (“Revenue pie chart”) shows the percentage distribution of all revenue resulting from different traffic sources, in the selected time period.

Table
In every line of the table you will find the following data:
- Referrer: the typology of the specific traffic source
- Conversions: the total number of monetary conversions in the selected time period
- Visits: the total number of visits generated by the specific traffic source
- Bounce Visits: the total number of bounce visits, that is the number of visits by browsers, coming from the referrer under examination, that entered the site, viewed a single page and exited the website
- Conversion Rate: the percent of monetary conversions coming from the referrer under examination out of the total visits coming from the same referrer.
- Revenue: the total revenue generated by the specific referrer in the selected time period
- Value/visit: the "value per visit" is given by the total revenue resulting from monetary conversions generated by the referrer under examination divided by the total number of visits from the same referrer in the selected time period
- Average value: the average revenue per orders from the traffic source under examination; it is given by the total revenue divided by the total number of monetary conversions generated by the referrer under examination in the selected period
 for each referrer, you can access the report that shows the list of all monetary conversions generated from the specific referrer in the selected time period.
Direct request
The term Direct request indicates all the conversions not coming from links located on other sites, for example in case your visitor enters your site URL directly in the browser address toolbar or he reaches your site via the link saved within the 'Bookmarks' / 'Favourite' sites.
No referrer
The term No referrer is assigned to all the requests to the ShinyStat servers with an incorrect or absent 'referrer' heading.
Value per visit
The "value per visit" is given by the total revenue resulting from monetary conversions generated by the referrer under examination divided by the total number of visits from the same referrer in the selected time period.
Value per visit = Revenue / Visits
This is an indication of the maximum amount that could be invested in the traffic source under examination.
In particular, in Keyword Advertising Campaigns (Pay per Click), the "value per visit" is a strategic factor, suggesting the maximum bid for each keyword.
Watch Out!
ShinyStat™ aggregates the data according to the "principle of the first referrer", ie. according to the initial source of the first visit.
For example: if a user enters the website for the first time coming from a search engine without effecting any conversion, and s/he comes back later through a campaign and converts, in the report about the Origin of Conversions, this conversion will be attributed to the search engine and not to the campaign, according to the "principle of the first referrer".
In the event that you wish to examine in detail all the conversions generated by a campaign, both when the campaign was the first referrer and when it was the last one, you can check the report called Monetary Global Conversions from campaigns.
This reports makes it possible to understand the relevance of campaign in the conversion process, as it lets you view for each conversion when the campaign was the first referrer and when it was the last one.
* Attention! Bounces are available since July 2010.
