B2B Module > Details > Referrers - Blog and Social Networks
In the report entitled "Referrers > Blog and Social Network" it is possible to verify from which Blog and Social Network visits arrived in the selected period.
The Blog and Social Network listed represent the web pages containing the links on which the Company clicked to reach your site.
The first table shows the number of domains listed in the table below and the number of visits received by the company from the sites listed.
Filters
- Calendar: it allows you to select the time interval for which you want to analyse the traffic data. For more info, click here.
- Show: this feature allows to view single URLs or to group URLs per domain.
- Search: you can quickly find the desired site by entering its name or part of it in the available field.

Table
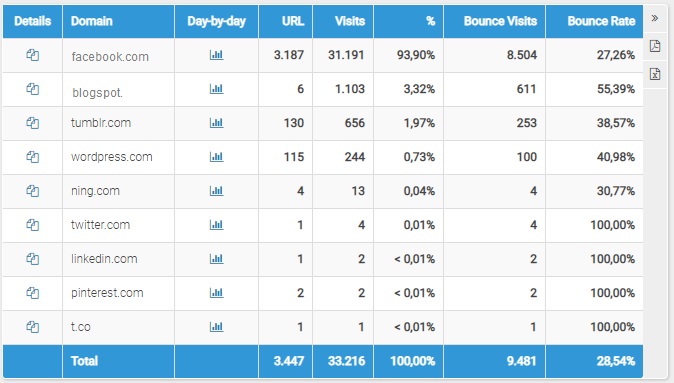
Each table row shows the following data:
- Pa-Re: by clicking on the “Pa-Re (Referrer Pages)” icon (Landing Pages of each Referrer) for each Blog or Social Network, you access the report that shows the list of Referrer Pages, ie the entry pages through which the company entered the site starting from the site in question
- Domain: indicates the address of the Blog or Social Network from which the Company arrived on the site
- URL: it indicates the number of URLs from which the Company arrived on the site
- Visits: the number of visits by the Company coming from the domain (Blog or Social Network) under examination
- %: the percentage of visits received by the Company through the Blog or Social Network in question compared to the total visits from the sites listed
- Bounces(*): the number of times when the landing page was the only page viewed during a visit, that is the number of visits by browsers that, coming from this specific URL, entered the site, viewed a single page and exited the website
- Bounce Rate(*): the percent of visits coming from the referrer under examination, consisting of a single page view out of the total visits coming from this referrer
If you choose to display the referring URLs, you can view the details per URL by clicking on the icon next to the domain.
- By clicking on the "Day-by-day" icon you can access the report that shows the trend of visits by the Company coming from the specific Blog or Social network in the selected time period.
Total
For easier reading, the last row in the list shows the total listed values.
This value is the sum of the values in all the pages and not only of the value in the current page.
Bounce Rate (*)
The Bounce Rate, in connection with a traffic source, helps you in understanding the possible reactions of users when arriving on your site from a specific web page.
A high Bounce Rate could be due to a gap between the landing page and the expectations that an ad in the site has generated in the user.
The Pages report (Pages) lets you see in detail which pages have a higher "Bounce Rate" for a specific source, providing you with a useful set of statistics to figure out what are the problems for your visitors and optimize your investment.
For more information about Bounces, please take a look at the page called: Bounces - Bounce Rate
(*) Bounces and Bounce Rate are available only in ShinyStat Pro and ShinyStat Business version

