Tip: You can also use Looker Studio Explorer to explore your data using a single chart (Looker Data Studio > Data sources > Choose your data source from ShinyStat > Explore).
Create a report in Looker Studio (Google Data Studio)
To create a report with data from ShinyStat in Looker Studio, follow the steps:
- Go to Looker Studio > Data sources.
- Choose your data source from ShinyStat.
- Click Create report.
- Confirm adding data to your report.
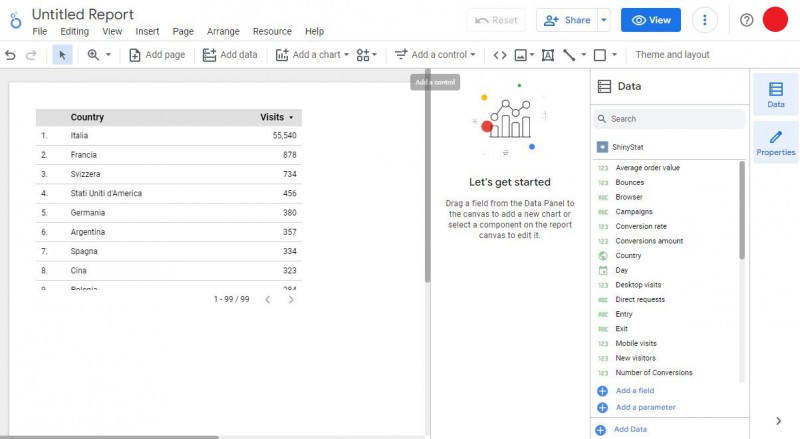
- You’ll see some sample data on the dashboard.

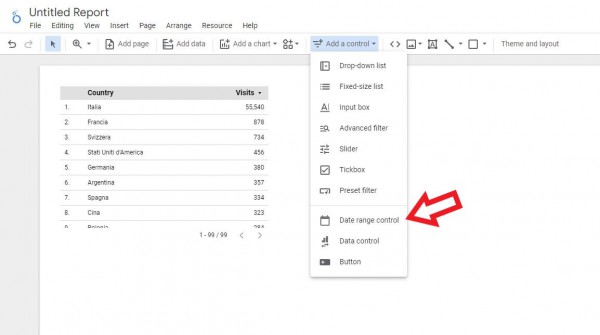
- Click Add a control and select Date range control. This will help you select date ranges for your data.

Note: By default, Looker Studio shows data for the last 28 days. - Pick any widget from Looker Studio and use metrics and dimensions on the right to create other elements in your report.
