Use filters with ShinyStat Analytics data
Guide for:

When working with ShinyStat data in Looker Studio, you can use filters the same way as in ShinyStat dashboards.
To add a new filter to your Looker Studio chart, follow these steps:
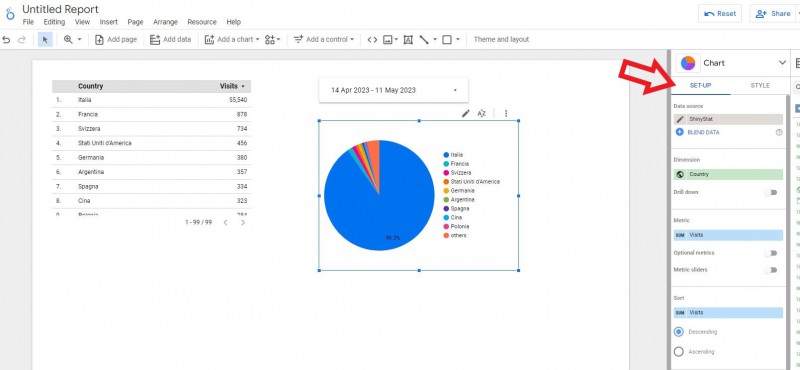
- Select a chart in your report.
- You’ll see the Setup tab on the right.
- Scroll down and click Add a filter.
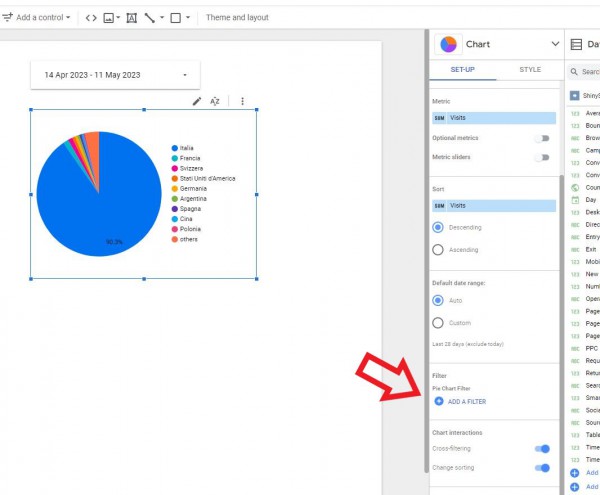
- Click Create a filter.
- Select the dimension that you want to filter with.
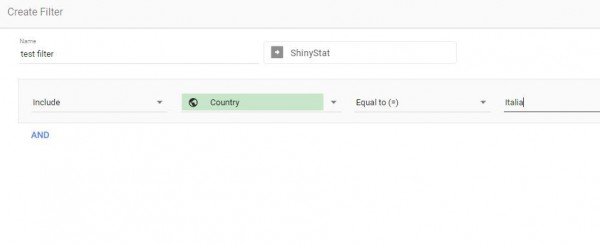
- Click Save.
- The filter will be saved and applied to your chart.
- Later, you can add the same filter to other charts in the report.