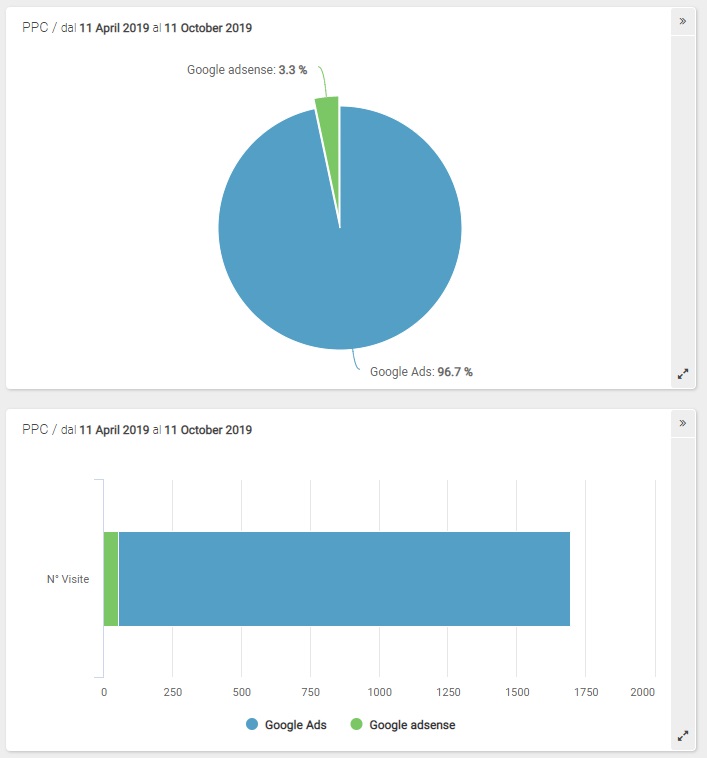
Video Analytics - Referrers - Campaign referrers
In the report "Campaign Referrers" you can see how many video views result from your online ad campaigns, properly set up using ShinyStat™ (see Campaigns from parameters and Campaigns from domains).
Filters
- Time period: by using the drop-down menu you can filter data for the time period you want to analyze.
- Advanced calendar: you can select specific time periods other than those available with the drop-down menu "time period", thereby choosing freely the time period to examine. For more info on using the Advanced calendar, click here.
- Search: you can quickly find the desired search keyword by entering its name or part of it in the available field.

Chart
The pie chart shows the percentage distribution of all video views resulting from active campaigns, among those which have been properly set up using ShinyStat™.
Table
In every line of the table you will find the following data:
- Campaign: the name given to the specific campaign during configuration
- Video views: the number of video views resulting from the specific campaign
- %: the percentage of video views with respect to the total number of video views resulting from campaigns
- Trend: the trend compared with the previous period
 , you can access the report that shows the trend of video views resulting from the specific campaign in the selected time period.
 Watch Out! The system keeps track of the traffic resulting from a campaign if and only if:
- the campaign has been properly set up and activated in the selected time period
- the ShinyStat™ code has been properly inserted in the page that the link points to (landing page)
