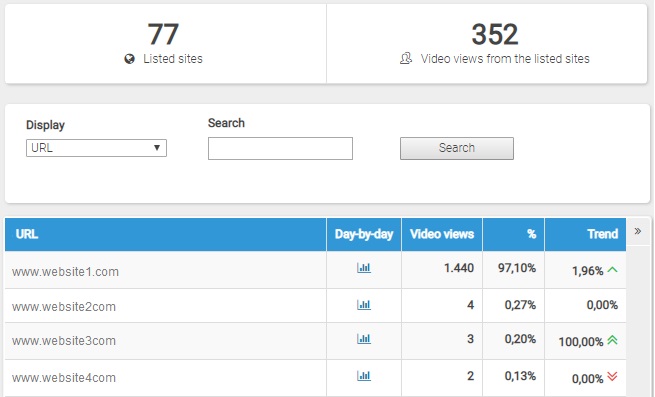
Video Analytics - Referrers - Sites
This report shows the number of video views generated by referrer sites. In fact, the URLs in the list represent the web pages containing the links your visitors clicked on in order to reach your videos.
The first table shows the total number of referring site in the selected time period listed below and the number of Video views generated by the sites in the list.

Filters
- Time period: by using the drop-down menu you can filter data for the time period you want to analyze.
- Advanced calendar: you can select specific time periods other than those available with the drop-down menu "time period", thereby choosing freely the time period to examine. For more info on using the Advanced calendar, click here.
- Category: by using the drop-down menu you can filter data for the category you want to analyze.
- Show: this feature allows you to view single URLs or to group URLs per domain.
- Search: you can quickly find the desired search keyword by entering its name or part of it in the available field.
Table Each table row shows the following data:
- Url (or Domain)
- Video views: it shows the total number of video views generated by the specific URL (or Domain)
- %: the percentage on the total video views coming from the site referrers
- Trend: expressed as a percent, it shows the trend of the video views for a given period. In particular, it indicates the percentage variation of the video views rate during the second half of the selected period compared with the first half of the period itself.
 for each keyword, you can access the report that shows the trend of video views brought by a specific URL in the selected time period.
If you choose to display the referring domains, you can view the details per URL by clicking on the "Details" icon next to the domain
 .
.Total
For an easier reading, the last row in the list shows the total listed values.
N.B. This value is the sum of the values in all the pages and not only of the value in the current page.

